| Parkinson's Measurement | Home PDMeasure Postings Data Studies Tools Philosophy Contact |
Geographical variations in the prevalence of Parkinson's Disease are of interest for a number of reasons. They may give clues as to:
- the aetiology of the disease;
- the effectiveness of various therapies;
- what environmental toxins are involved in PD.
In short, if we understood the spatial differences in PD's prevalence, we would be much closer to finding a cure.
This post goes into some detail into how to use data sets containing spatial data that are open to the public to map PD.
As far as I'm aware, there are only two papers that give detailed maps of prevalence across a whole country. One by Willis et al. [1] for the US. And one by Pedro-Cuesta et al. [2] for Spain. I've found nothing similar for the UK.
You should see two maps below. If they are not visible, your browswer is having problems rendering png files. Go to here and here to see lower quality jpg versions.
The maps are based on prescription data from June, 2012, from each of about 10,000 GP's surgeries in England. Some of the smallest surgeries will see very few PwP, so their results that may be misleading. To avoid this, only those practices writing at least 500 prescriptions in the month have been included in the analysis. This has left us with a final sample size of about 8400.
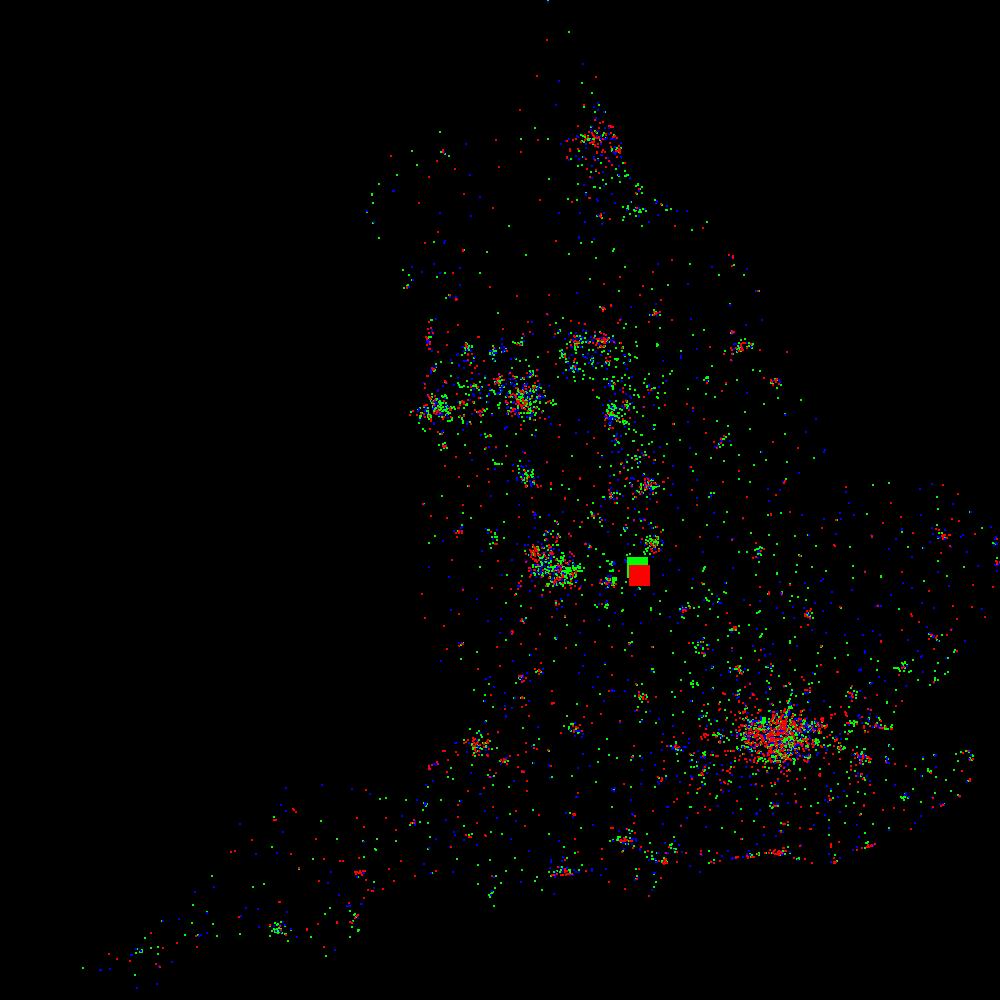
The maps show inferred relative PD prevalence (a term that is described below) which is a crude measure for true PD prevalence. It is the color of the dots which is interesting, not the number od dots (that reflects population density).
|
MAP 1: Green, 50% of clinics with the least inferred relative Parkinson's; blue, the next 25%. red, the highest 25%. The larger rectangles show the centres of gravity. |
MAP 2: Green, 5% of clinics with the least inferred relative PD. red, 5% highest |
The UK government through its Open Data initiative [3] has now made it easy to, at least, make a start on filling this gap. Amongst the many data sets that they have opened up to the public are ones relating to prescriptions.
The main condition for their use is that you attribute the source, which in this case is: Contains Ordnance Survey data © Crown copyright and database right [2012] Contains Royal Mail data © Royal Mail copyright and database right [2012] Contains National Statistics data © Crown copyright and database right [2012] Provided you do this the Open Government Licence gives you the right to use, distribute and adapt the data.
For this work I've used two data sets: -Raw data for June 2012, from files T201206PDPIEXT.CSV and T201206ADDREXT.CSV obtained from [4]. "All prescribed and dispensed medicines (by chemical name), dressings and appliances (at section level) are listed for each GP practice. -For each GP practice, the total number of items that were prescribed and then dispensed is shown. -The total Net Ingredient Cost and the total Actual Cost of these items is shown." The second file gives addresses including, importantly, postcode. -Positional data from the Ordnace Survey, Code-Point data set [5]. This gives Easting and Northing information for each postcode.
There are approximately 10,000 GP practices in England and each is in the dataset. From the point of view of mapping the density is excellent.
The crucial question is: How do we extract prevalence data?
Strictly speaking, we don't. Instead we look for a weaker measure: relative prevalence. This allows us, in this context, to answer questions like, Where in England is PD most common?, but not how many people in England have PD? Or how this compares with the US?
So, we're looking for a measure of relative PD prevalence. That's not in the database either. A proxy is used:
| NUMBER PARKINSON'S PRESCRIPTIONS | |
| INFERRED RELATIVE PREVALENCE = | ----------------------------------------------- |
| TOTAL NUMBER PRESCRIPTIONS |
I listed the "Parkinson's drugs" in a recent post on NeuroTalk [6].
Is this a perfect measure of the true rate of PD prevalence? Of course not, for instance: - PwP not on prescription drugs are missed; - doctors who prescribe two different drugs, rather than double the quantity of a single drug will get twice the inferred prevalence; - doctors who prescribe small quantities, e.g. a week's supply rather than a month's, on each prescription will have higher rates; - different local prescribing regimes will lead to differing inferred rates; - demographics, like age profile, are missed; - changes in the use of non-Parkinson drugs at place A will impact on the relative inferred rate at place B. - some of the Parkinson drugs can be used for other conditions, etc.. But, although these problems will certainly add noise to the statistics, I don't think they will invalidate the whole approach.
And the results? It is early days yet, but some things can be seen:
Plotting the whole sample does not show large regional differences like those reported in the US. The most telling measure of this, albeit not a sufficient condition to disprove large variances in distribution, is that the "centres of gravity" of the source of all prescriptions compared with the PD prescriptions differ by only a few miles. See Map 1.
However, analyses based on on comparisons between the lowest and highest prevalence practices hint at spatial variations. For instance, Map 2 shows the bottom 5% and the top 15% of practices ordered by inferred rates, hint at variations, with the South West appearing to have higher prevalence rates. This may just reflect demographics.
Where to next? I'd like to normalize the data to account for age differences, look at more months of data and to do cluster analysis.I'll be grateful for people's comments. If anyone needs help getting started data mining, I'll be happy to help.
[1] "Geographic and EthnicVariation in Parkinson Disease: A Population-Based Study of US Medicare Beneficiaries"
Allison Wright Willis, Bradley A. Evanoff, Min Lian, Susan R. and Brad A. Racette
Neuroepidemiology. 2010 April; 34(3): 143–151.
http://www.ncbi.nlm.nih.gov/pmc/articles/PMC2865395/
[2]"Spatial distribution of Parkinson's disease mortality in Spain, 1989-1998, as a guide for focused aetiological research or health-care intervention"
Jesús de Pedro-Cuesta, Eduard Rodríguez-Farré and Gonzalo Lopez-Abente
BMC Public Health, vol 9, Dec 2009.
http://www.biomedcentral.com/1471-2458/9/445
[3] http://data.gov.uk/
[4] http://data.gov.uk/dataset/gp-practice-prescribing-data
[5] http://www.ordnancesurvey.co.uk/oswebsite/products/code-point/index.html
[6] http://neurotalk.psychcentral.com/thread179755.html
John